You can use the Maternal and Infant Health Mapping Tool to find county-level information on maternal and infant health. You can create and customize maps for your needs. This webpage contains both written instructions and video tutorials.
Step-by-step instructions
- Open the Maternal and Infant Health Mapping tool.
-
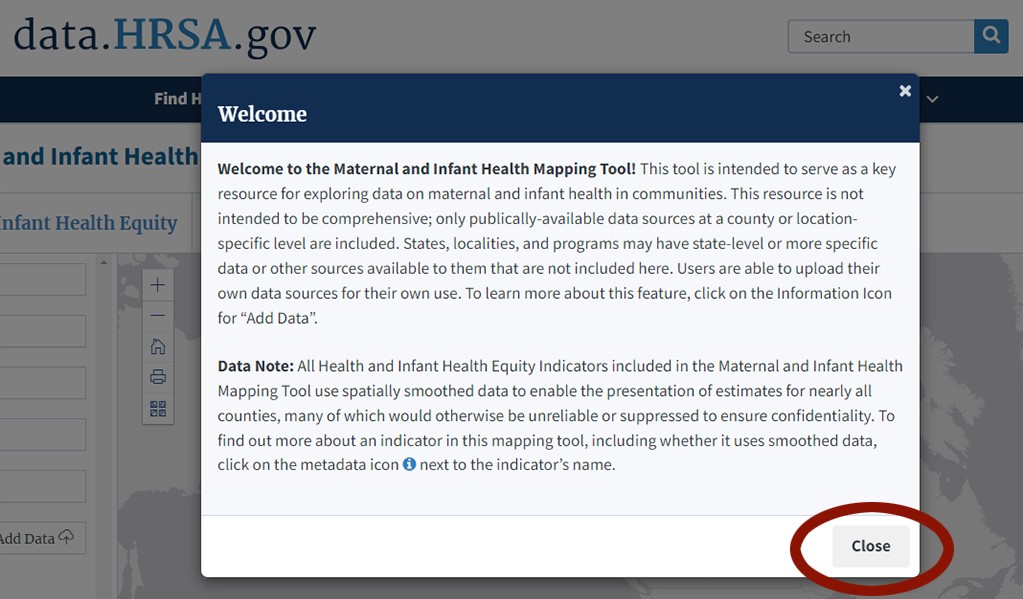
Read the information provided in the Welcome Window. Then, select "close."
-
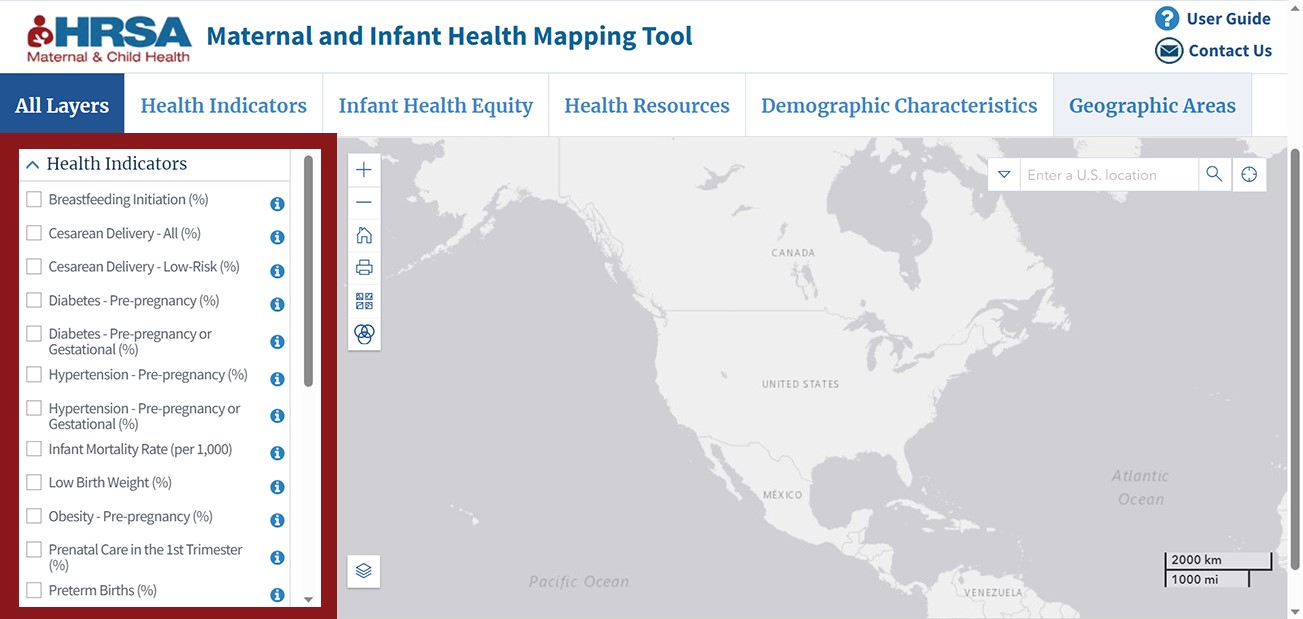
Observe that the Tool contains a map along with many categories. Categories of data elements are provided in the navigation bars across the top of the window and then repeated down the left side of the window. The categories of data are health indicators, infant health equity, health resources, demographic characteristics, and geographic areas.

-
Each category contains a list of measures. For example, select the dropdown arrow next to “Health Indicators.”

-
Selecting the arrow reveals a list of data measures in that category. Each measure can become a separate data layer on the map.
-
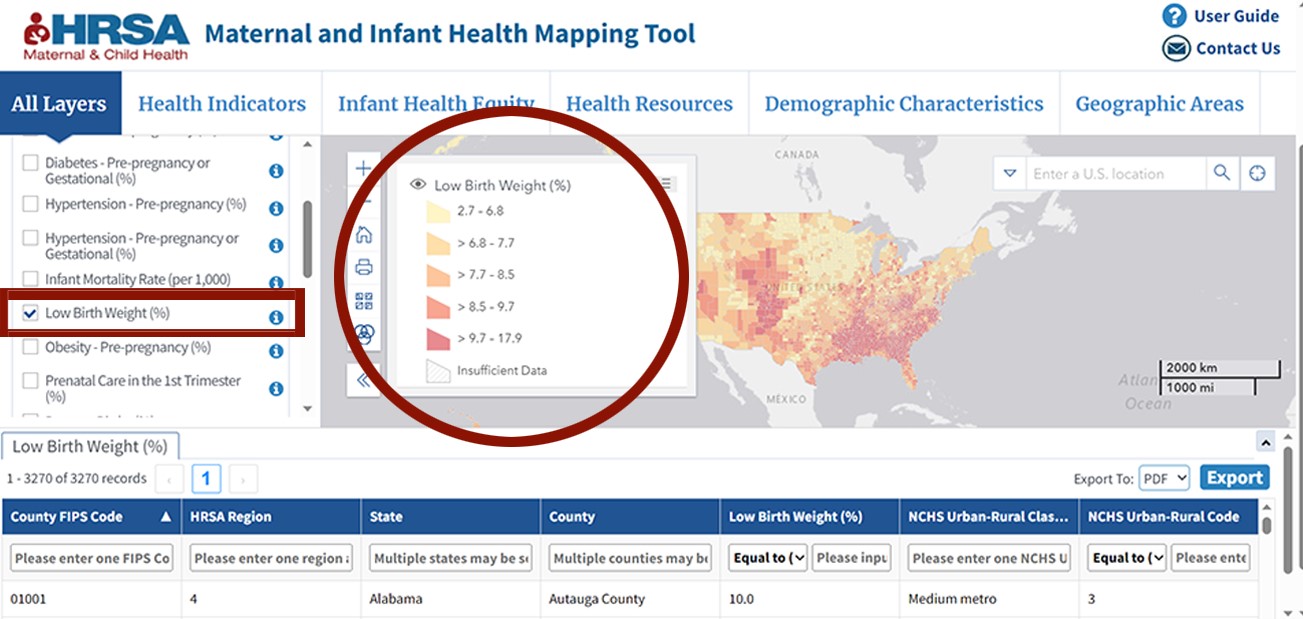
Select the box next to a data layer [Low Birth Weight (%)] to turn on the data layer and display it in the map.

-
The map will display the data, including a legend to show the range of data values for each color.
-
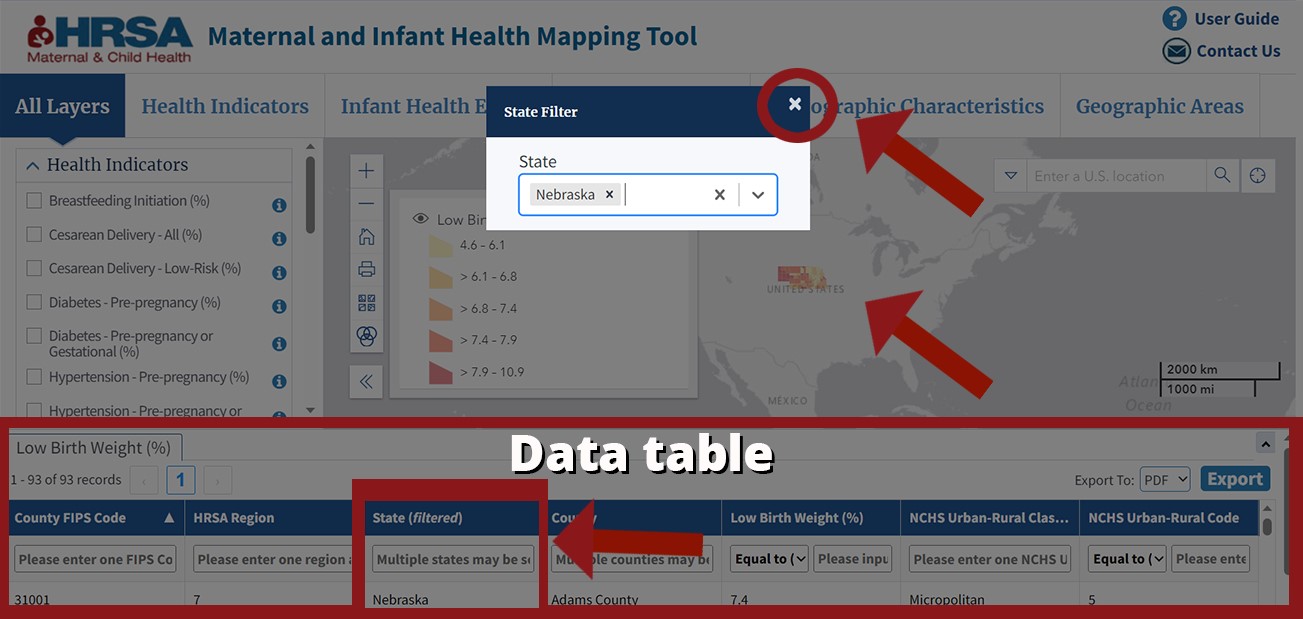
A data table appears below the map. At the top of the data table are fields you can use to filter the data and change what is shown in the map. This example shows Nebraska. To filter for a state, select the state field within the data table. A popup window appears. Type Nebraska. The map displays data only for Nebraska. To remove the popup window, select the "X".
-
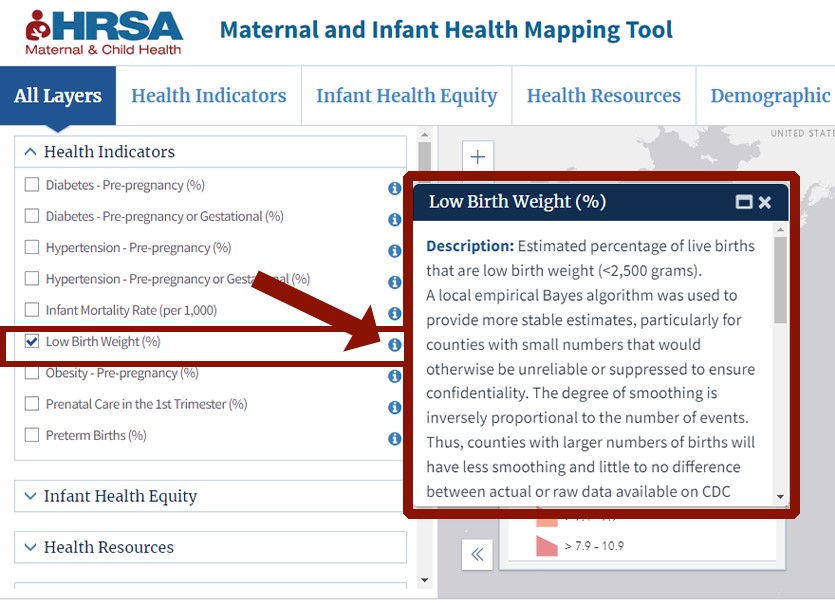
Select the “i” icon next to the Low Birth Weight indicator. A pop-up window provides a definition for that data layer, the years, the source of that data, and a URL where you can find more information. Together, this information is “metadata.”
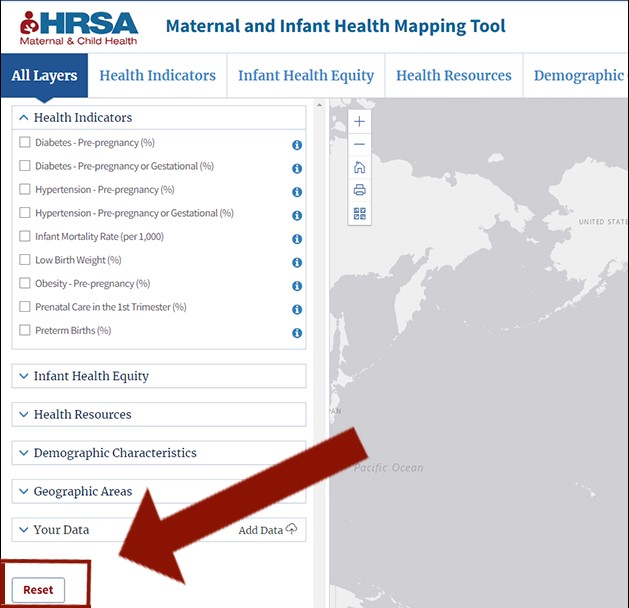
To clear data measures, select the reset button located at the bottom of the list of data layers on the left side of the mapping tool.
- For more information and instructions, select the User Guide on the top right side of the mapping window or Contact Us at MIHMapping@hrsa.gov.
Use these instructions to understand how to use the map or the data table to find specific information. In this example, we will explore the Low Birth Weight indicator.
-
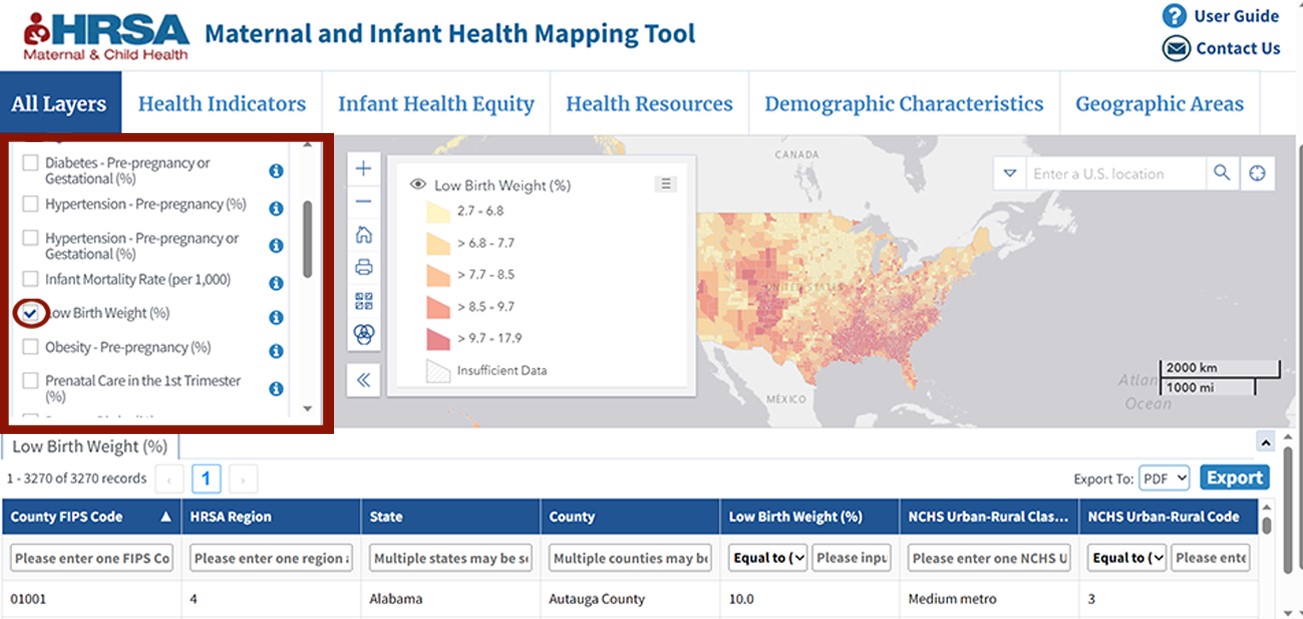
With the mapping tool open, select the Low Birth Weight data layer within the Health Indicators category.
-
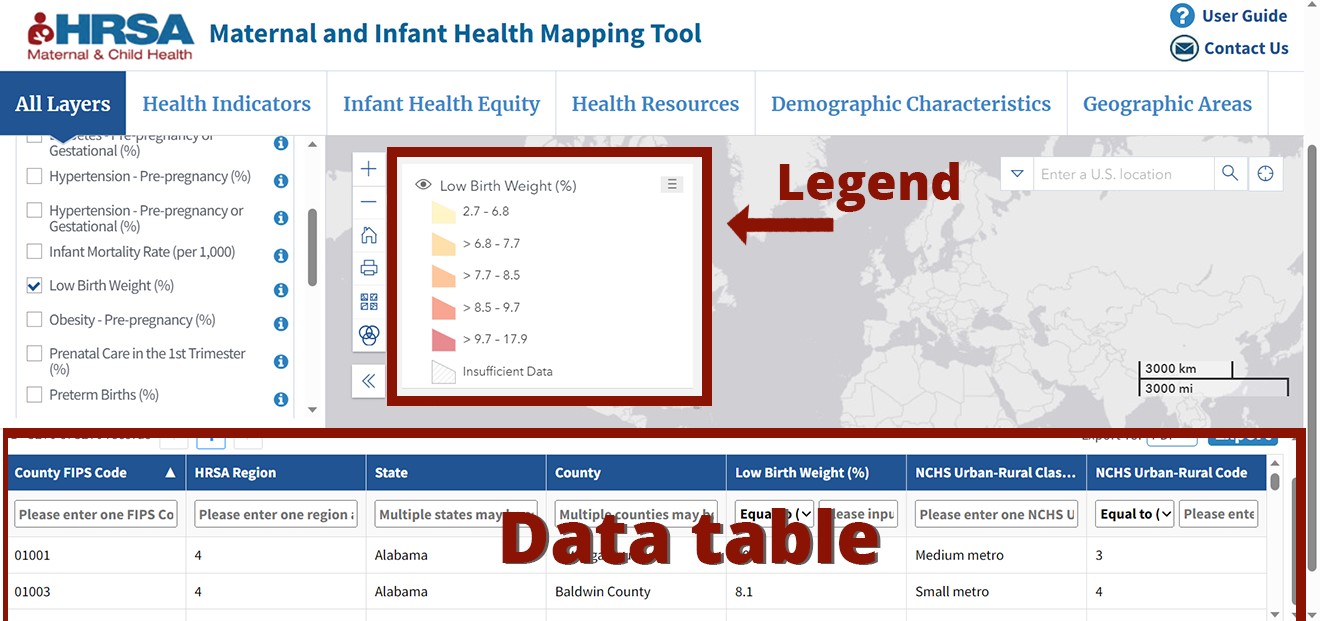
The map will display the data, including a legend to show the range of data values for each color. The data also display in table format below the map. You can navigate to find location data using either the map or the data table.
-
To use the map to navigate, type a location into the search bar located on the map. For this example, start to type “Clay County” into the search bar and select "Clay County, Mississippi" from the list of options.

-
The map zooms to show this county. The county is outlined with a blue line.

-
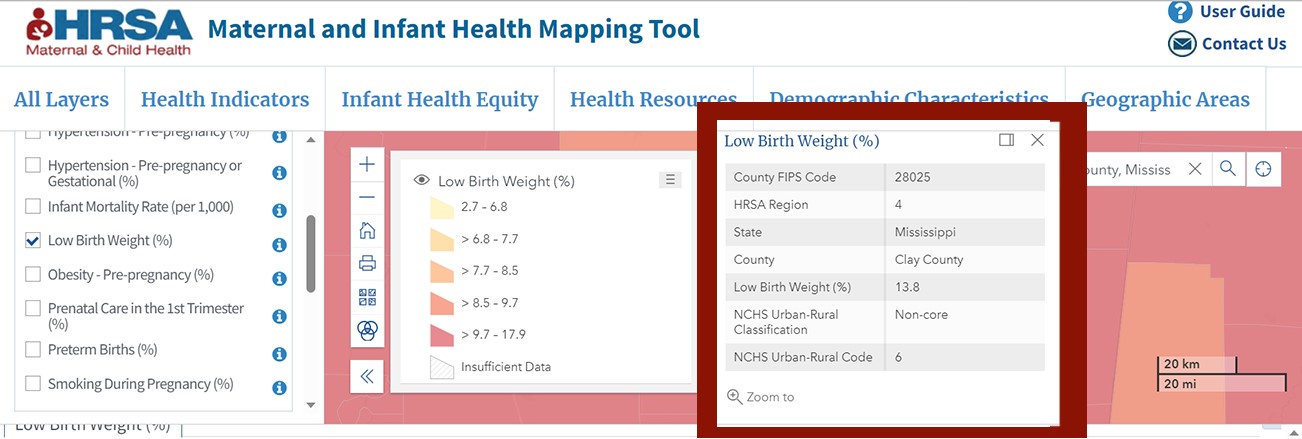
Select anywhere within the county outline and a popup box appears providing details including the value for the Live Birth Weight indicator (the percentage of live births that are low birth weight) in this county.
-
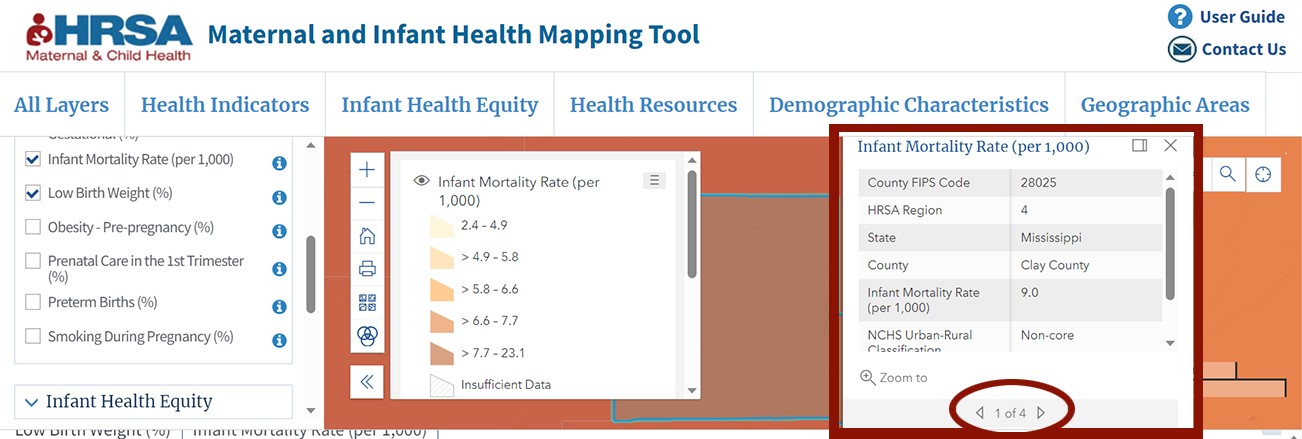
Note: Should you select a second indicator, for example Infant Mortality Rate, and select within the county outline again, the popup window will display arrows with a “1 of 4” so that you can cycle between information about each specific data layer.
-
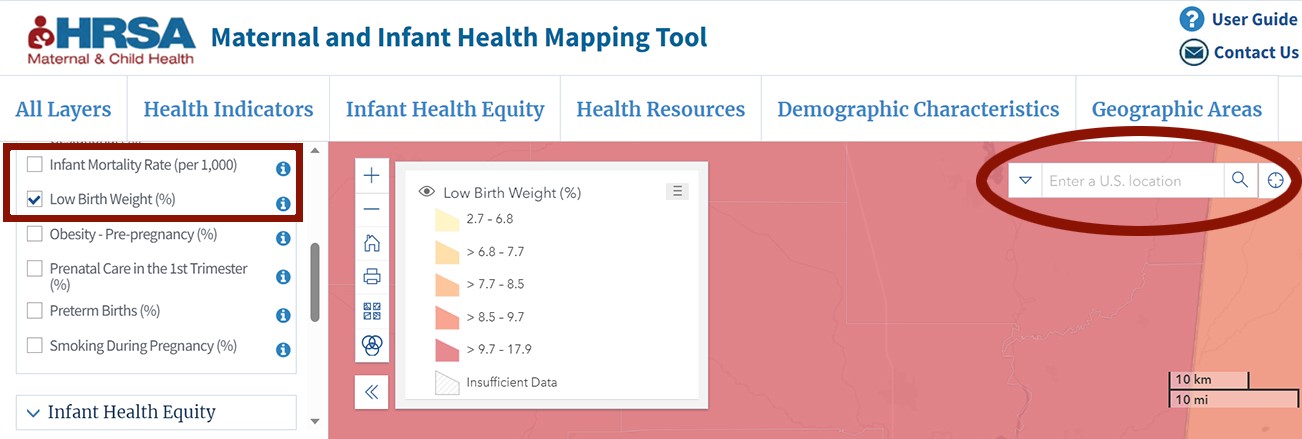
Unselect the extra data layer, for example Infant Mortality Rate, and clear the search box by selecting the "X" next to the county name.
-
Use the data table to search for information on Low Birth Weight in the location, Clay County, Mississippi. Select the state column of the data table. A popup window appears. Enter Mississippi. Then select in the county column. A second popup window appears. Enter Clay County. The Low Birth Weight data display in the Low Birth Weight column at the end of the table.

Video tutorials
How this tool can help you
We designed the Maternal and Infant Mapping Tool to help federal, state, and local decision-makers and others visualize factors that affect maternal and infant health. Use the information to understand needs, plan programs, and target resources.
This tool allows you to map maternal and infant health indicators and overlay demographic characteristics (like population density and number of births) and health resources (such as health centers and National Health Service Corps sites offering women’s health services), with information available down to the county level. The mapping tool allows users to upload their own data, creating customizable maps for program planning.
- Launch the tool to explore the data and map features.
- Refer to the User Guide for a full explanation of the mapping tool and some step-by-step instructions.
Recommended citation for maps
Map citation: Health Resources and Services Administration. Maternal and Infant Health Mapping Tool: https://data.hrsa.gov/maps/mchb/. Accessed on [date].
Downloaded data citation: Data downloaded from the Maternal and Infant Health Mapping Tool, a website developed by the Health Resources and Services Administration, Maternal and Child Health Bureau. https://data.hrsa.gov/maps/mchb/. Accessed on [date].
For questions or more help
Reach us at MIHMapping@hrsa.gov